Case study / 01
APIM Observability Dashboard
A centralized observability dashboard for more than 180 APIs, helping teams across 14+ countries investigate errors, latency, and unauthorized requests.
- Organization
- UFINET
- Project status
- Completed
- Next.js
- Azure API Management
- Application Insights
- Azure Monitor
- PostgreSQL


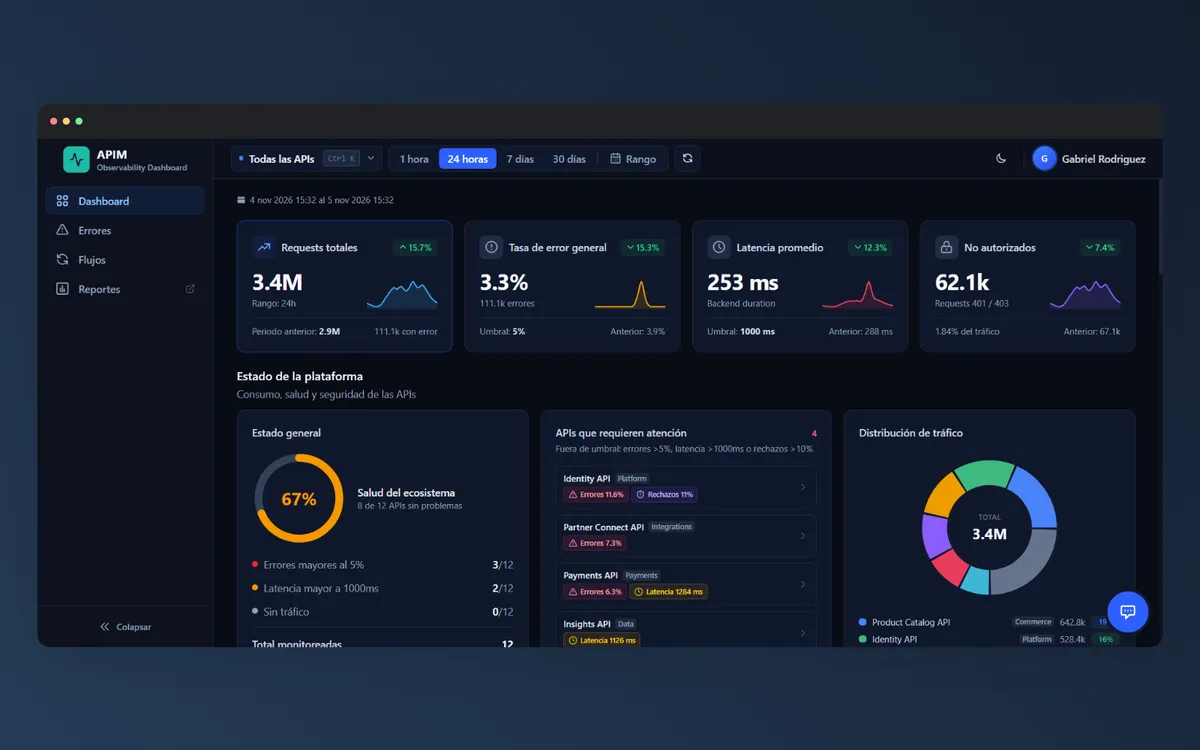
Confidentiality note: Real metrics, user identities, and proprietary information in the screenshots have been replaced with simulated data.
The challenge
UFINET needed a clearer view of more than 180 APIs across development, QA, and production. Teams in more than 14 countries needed to investigate errors, latency, and unauthorized requests, but accessing that information required navigating Azure logs or knowing Kusto Query Language (KQL).
API ownership and business names also lived largely in architects’ knowledge rather than in a central source, making it harder to connect technical failures with the teams responsible for resolving them.
My role
Starting from my manager’s initial concept and a minimal Next.js project, I designed the interface and led the implementation of the application architecture, authentication, granular roles, AI integration, deployment, and ongoing production maintenance.
I owned technical decisions, incorporating feedback from architects, developers, and business stakeholders. Their input helped establish API ownership and business names; my manager also defined requirements such as custom date ranges and reports generated from dashboard data. The goal was to make investigations easier across more than five development teams while protecting business-sensitive information.
Building the solution
Centralized data access on the server
I used Next.js for the interface, server endpoints, and authentication. The server queries Azure Monitor, Application Insights, and Azure API Management (APIM), using an app registration for Azure access. Predefined KQL queries retrieve telemetry according to the selected filters, and the server returns JSON to the interface. Keeping Azure access on the server avoids exposing credentials to the browser.
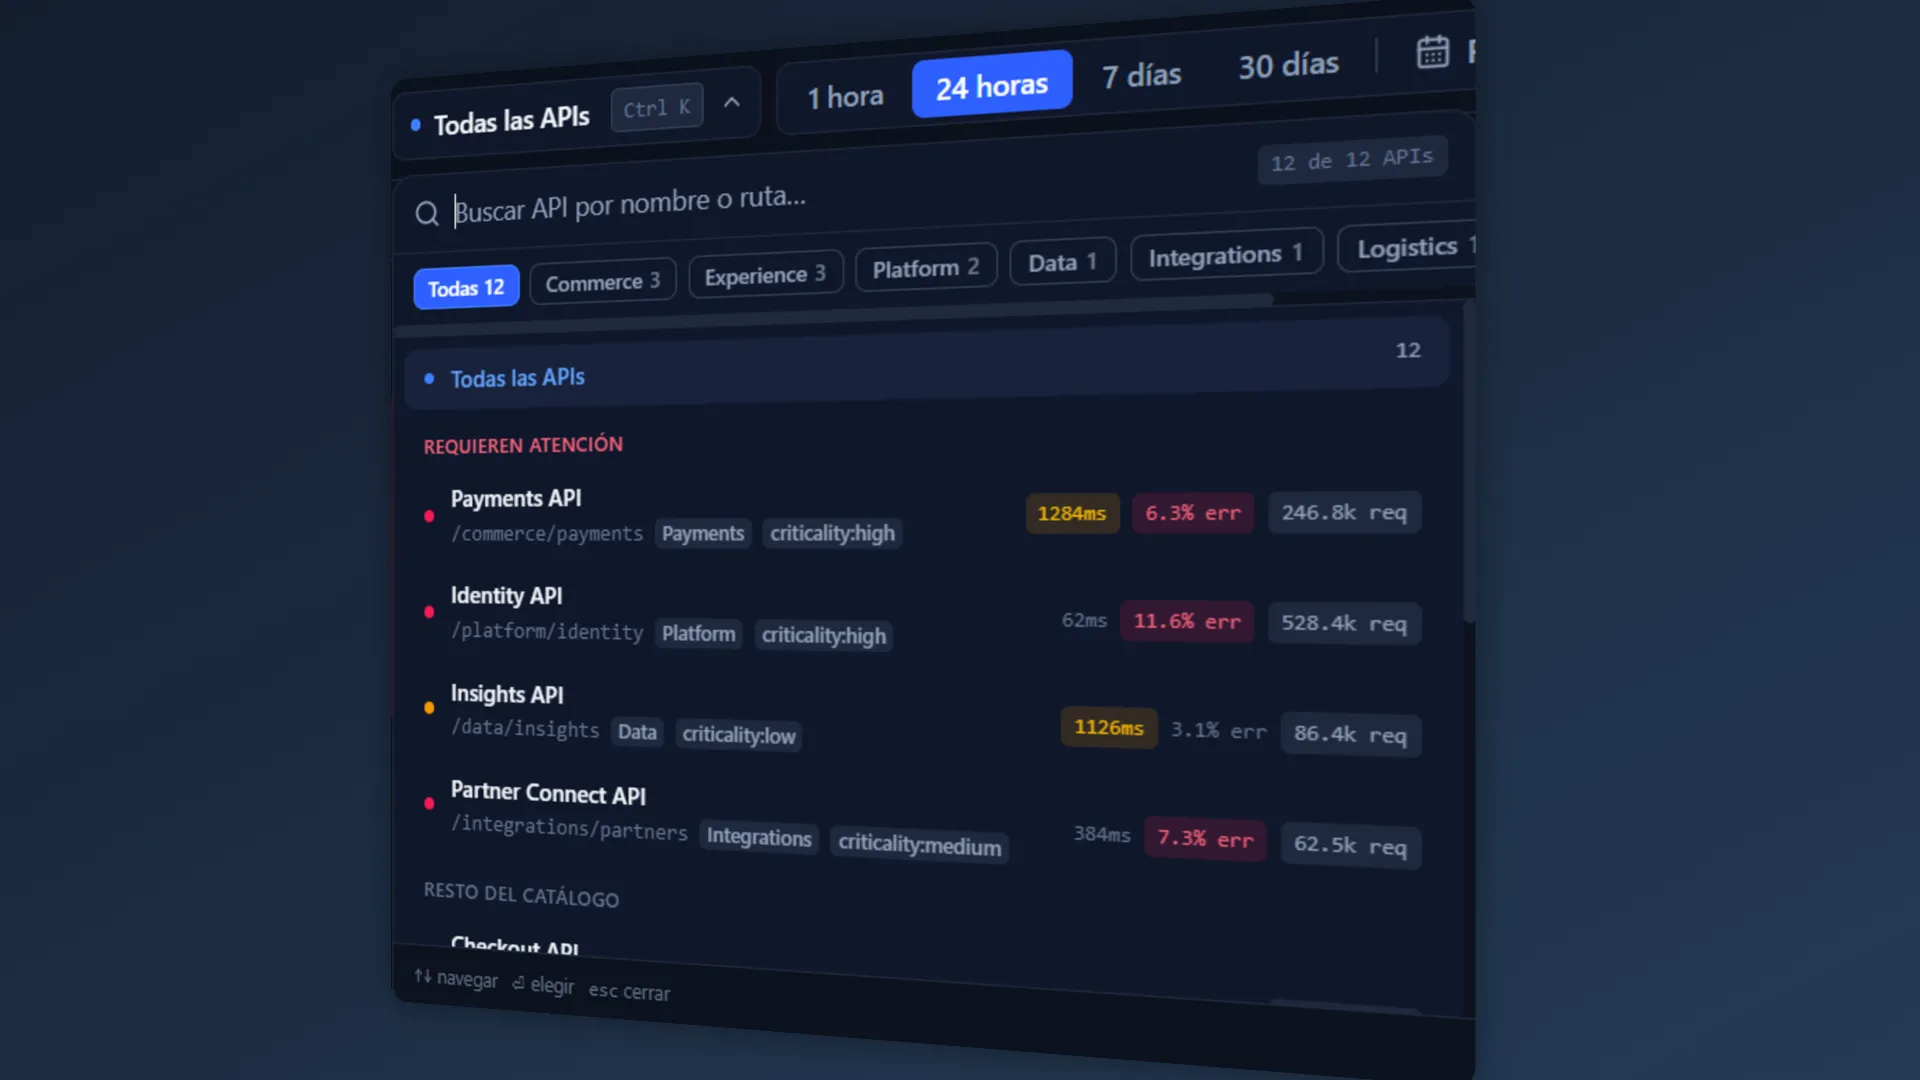
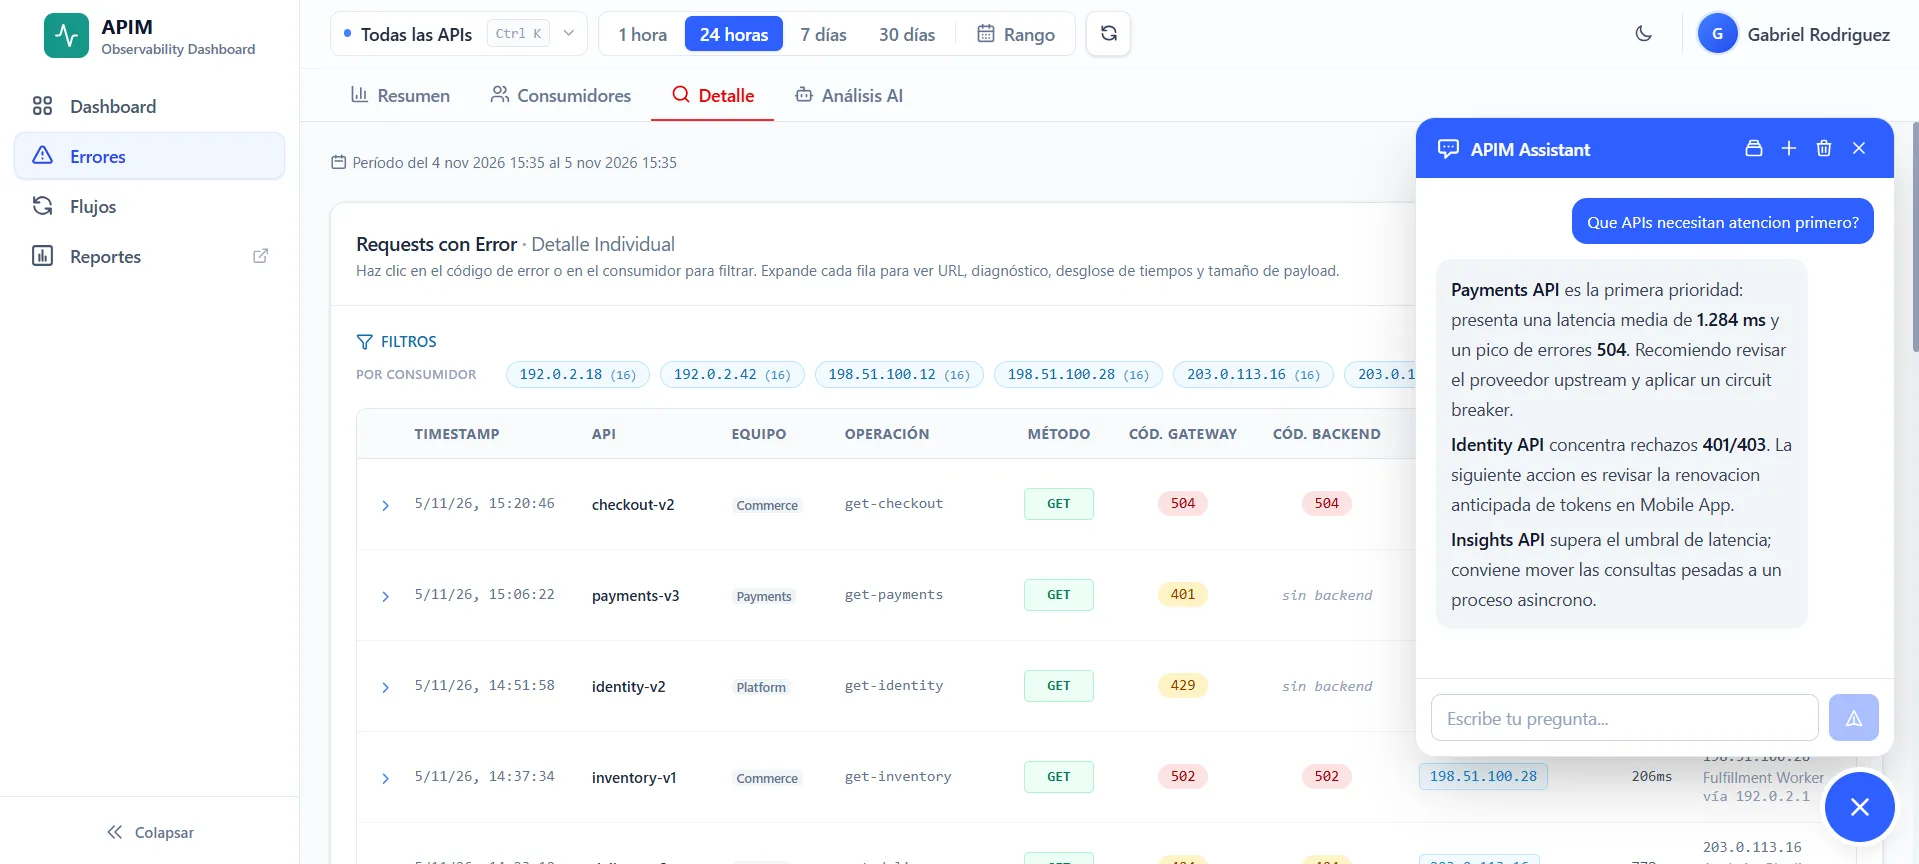
Users can filter by team, API, and predefined or custom time ranges. The error view groups failures by status code and shows affected consumers and individual failed requests. PostgreSQL stores AI-generated reports and chat conversations, while telemetry is queried from Azure.
Made error rates clear and verifiable
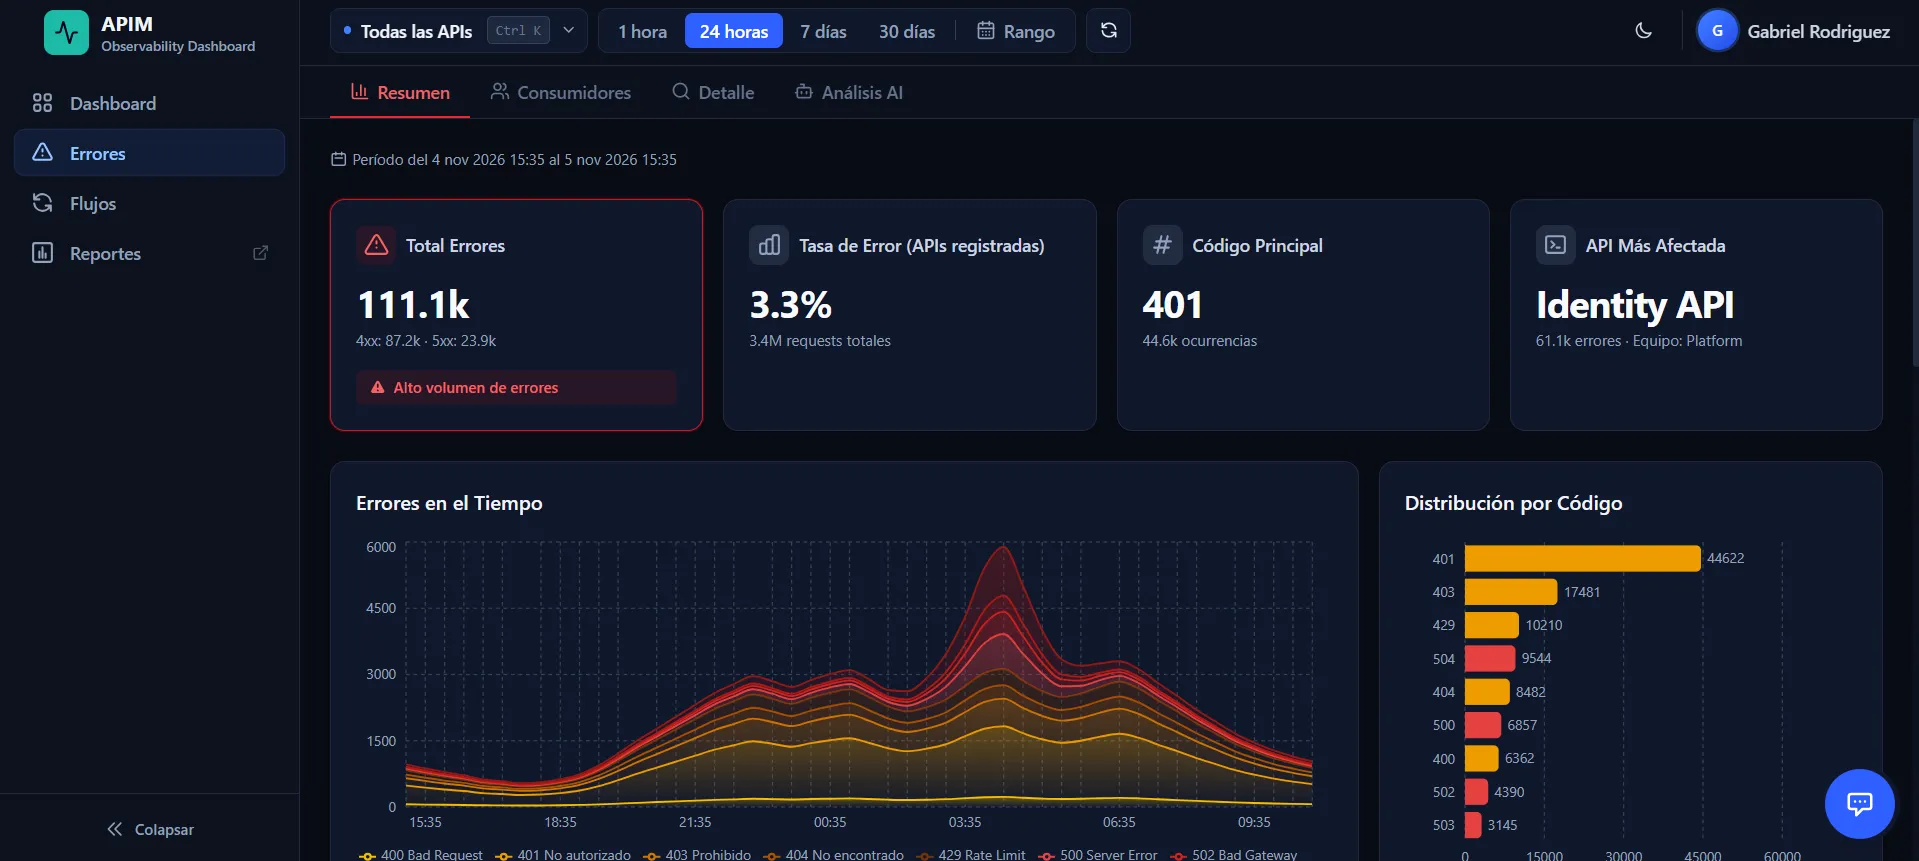
When the Head of Software noticed different error rates on the dashboard and error pages, I traced the discrepancy to the requests included in each calculation. The dashboard used Azure Monitor data covering all requests; the error page’s Application Insights queries included only requests associated with an API ID.
Some requests reach APIM without an associated API ID and return errors such as 401 or 403. These can come from misconfigured clients or scanning traffic, even with a Web Application Firewall (WAF) upstream. Excluding them changes the scope of the error rate.
I retained both metrics because they answer different questions: Overall error rate shows the broader request picture, while Error rate (registered APIs) focuses investigation on known APIs. I made that distinction explicit in the metric cards and validated the displayed results against Azure Monitor and Application Insights using direct queries.
This gave engineers and managers a clear explanation for the difference and made existing telemetry easier to interpret without navigating Azure. I also worked with business stakeholders to define abnormal error and latency thresholds based on each service’s expected behavior.
Connected APIs to their owners
I worked with architects and other teams to identify API owners and the business names used for their services. Because production APIM had constraints that made business names difficult to assign reliably, I designed a key-value convention using APIM tags, with keys and values separated by a colon. The tags record ownership and business names, allowing the dashboard to reflect changes automatically and helping users identify the right team.
I considered maintaining a separate catalog in another repository, but chose APIM tags because they also help team members quickly identify APIs directly within APIM.
Protected access with granular roles
I integrated NextAuth with Microsoft Entra ID for corporate single sign-on. Access requires an assigned App Role, with granular permissions such as Viewer.All and Viewer.Dashboard determining which views users can access. Separate roles govern AI features and automated flow execution, allowing feature access and AI usage to be managed by responsibility.
I used Azure Key Vault for sensitive secrets and deployed the application to Azure Container Apps within a private Container Apps Environment. Network protections include ingress restrictions and a WAF with geographic restrictions aligned with the countries UFINET operates in.
Turned selected telemetry into downloadable AI reports
I integrated OpenAI to analyze either all APIs or a selected API. When a user generates a report, the application sends the model a JSON payload containing relevant error metrics, consumer information, and request details for the current selection. The model returns JSON that the frontend renders as a visual, downloadable report.
A contextual chat supports questions about the information displayed on the current screen. PostgreSQL persists generated reports and chat conversations.
Maintained the application in production
I handle bug fixes, feature updates, and usability improvements through an Azure DevOps pipeline that deploys application changes. This extends my ownership beyond delivery into ongoing production maintenance.
Impact
- Supported a recent API incident investigation with AI-generated reports: the team requested reports from the application to investigate the issue, which was resolved the following day.
- 180+ APIs brought into a shared observability solution across development, QA, and production.
- 14+ countries and 5+ development teams supported with filtering and access to API information without requiring KQL knowledge.
- Clear, validated error rates distinguish overall request errors from errors associated with registered APIs, helping engineers and managers interpret results correctly.
- API ownership and business names maintained through APIM tags, allowing the dashboard to reflect changes automatically.
What’s next
- Keep automating alerts for errors, latency, and other business needs using existing centralized team groups.
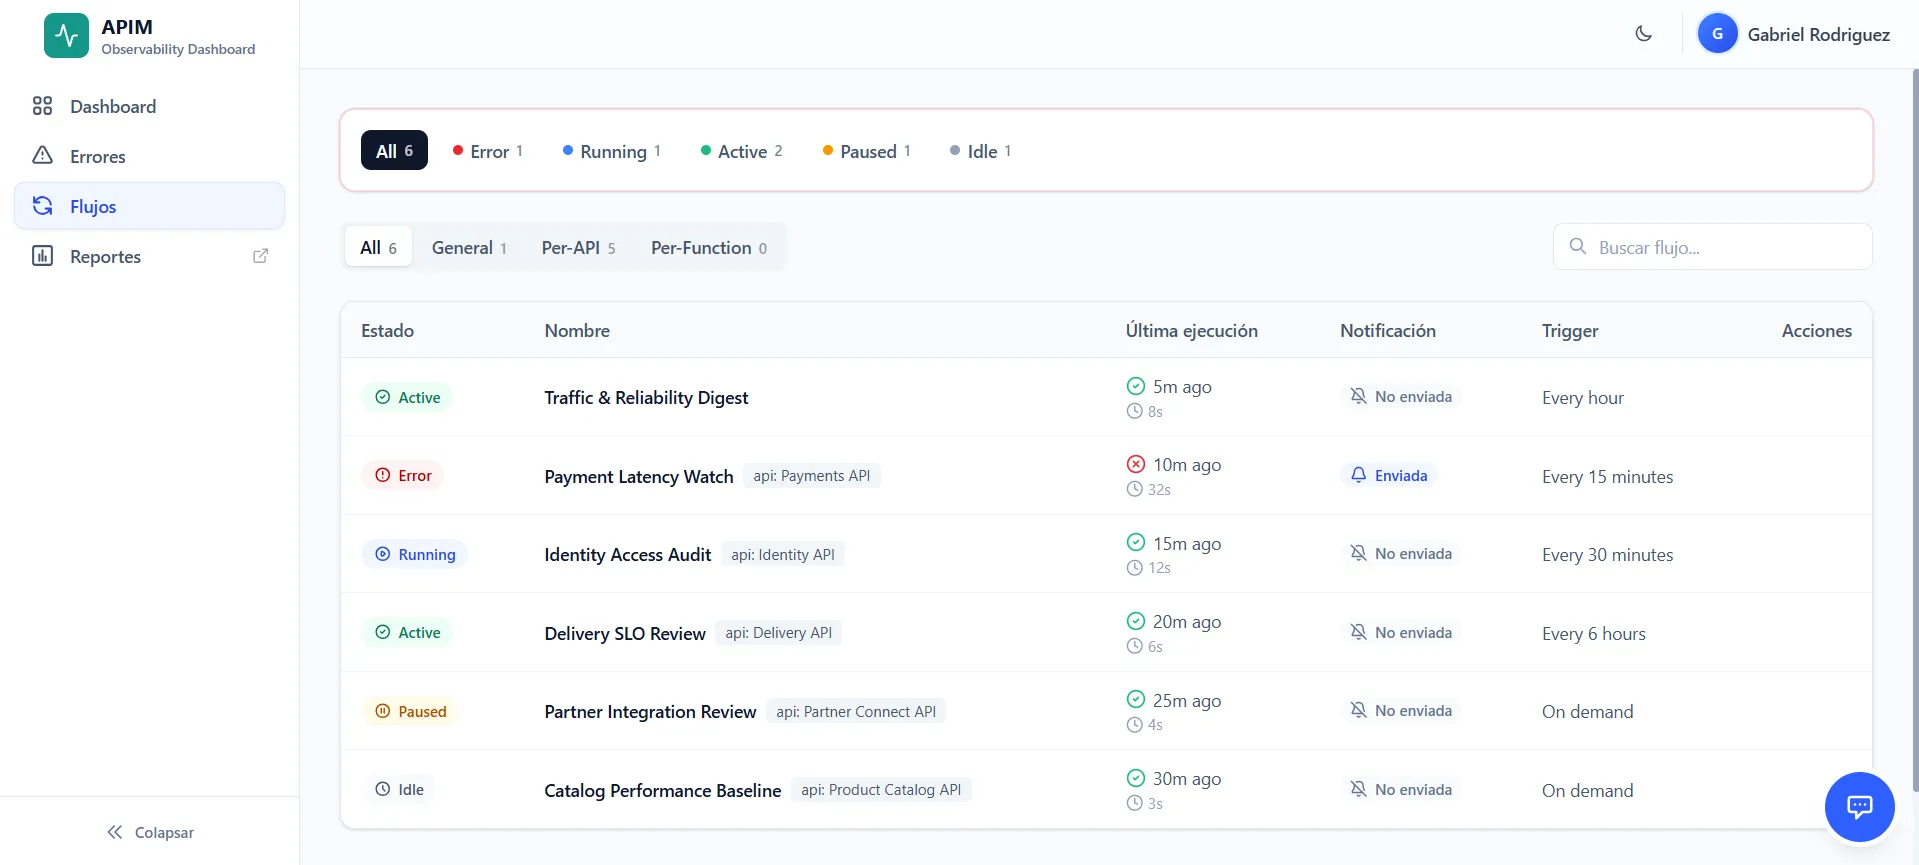
- Improve the separate Flows page with more detail on execution logs and potential errors.
- Add monitoring for Azure Function Apps.
- Add an API Health section to visualize API status and
/healthendpoints.